In trading, the market is constantly moving between two states: balance and imbalance.
Understanding how price behaves in each phase can help you identify where smart money enters, where retail traders get trapped, and where your best trading opportunities appear.
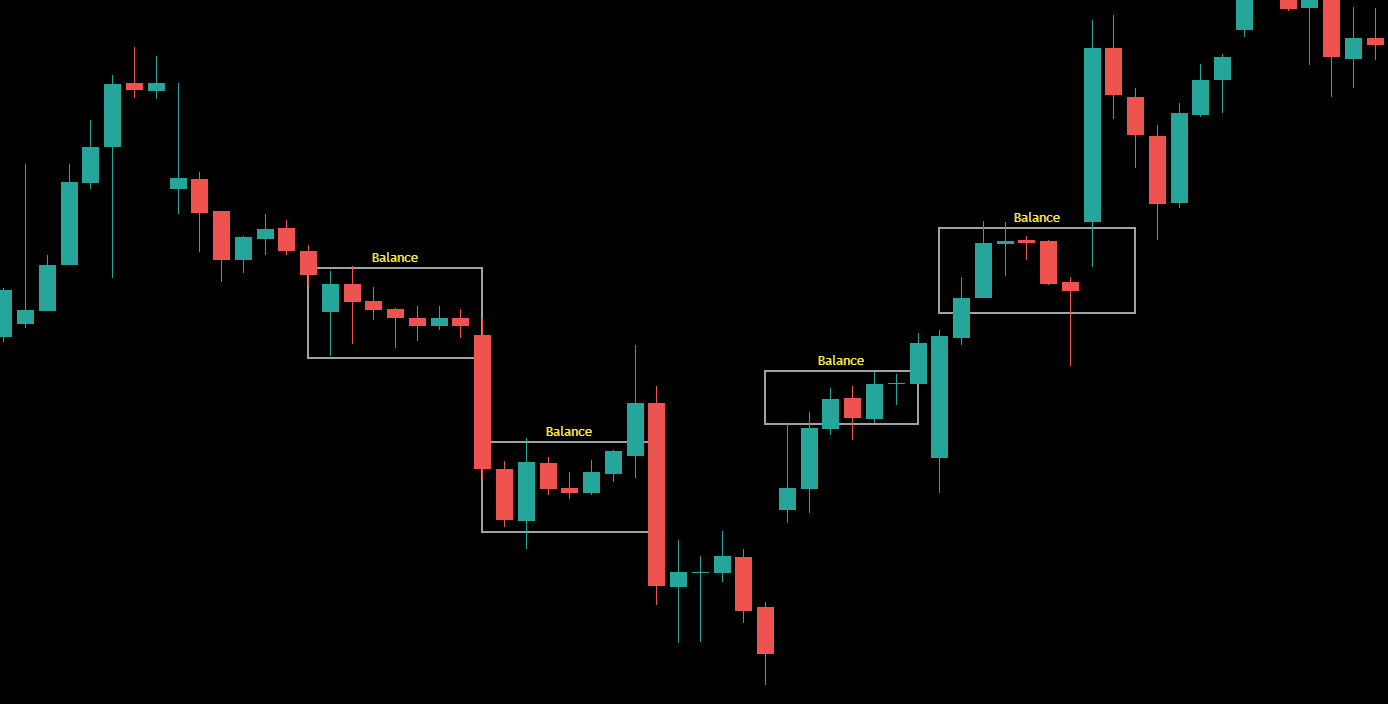
What Is Market Balance?
Balance occurs when buyers and sellers are in agreement about price. This usually shows up on your chart as sideways movement or consolidation (a range where neither side has taken control).
Think of balance like the market “catching its breath.” Institutions accumulate or distribute positions here, and liquidity builds up above and below these levels.
On the chart, balance is represented by multiple overlapping candles and wicks, signaling a temporary equilibrium in supply and demand.
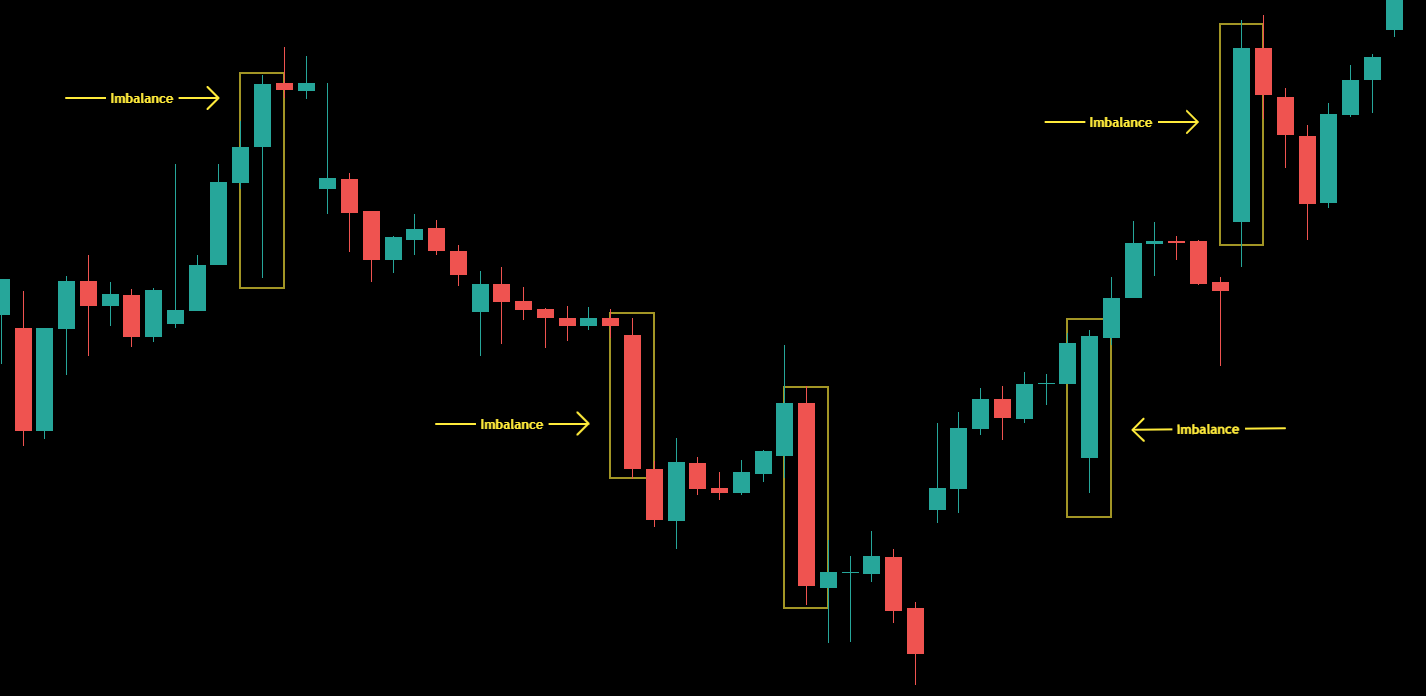
What Is Market Imbalance
Imbalance happens when that equilibrium breaks and one side overwhelms the other, creating a strong move in one direction.
You will often see this as large candles with little to no wicks. These areas are called Fair Value Gaps, and they represent inefficiency in price because not enough orders were filled.
Here is the key: the market does not like inefficiency. Over time, it tends to rebalance by returning to fill or test these imbalanced areas.
Fig 2 - Market Imbalance
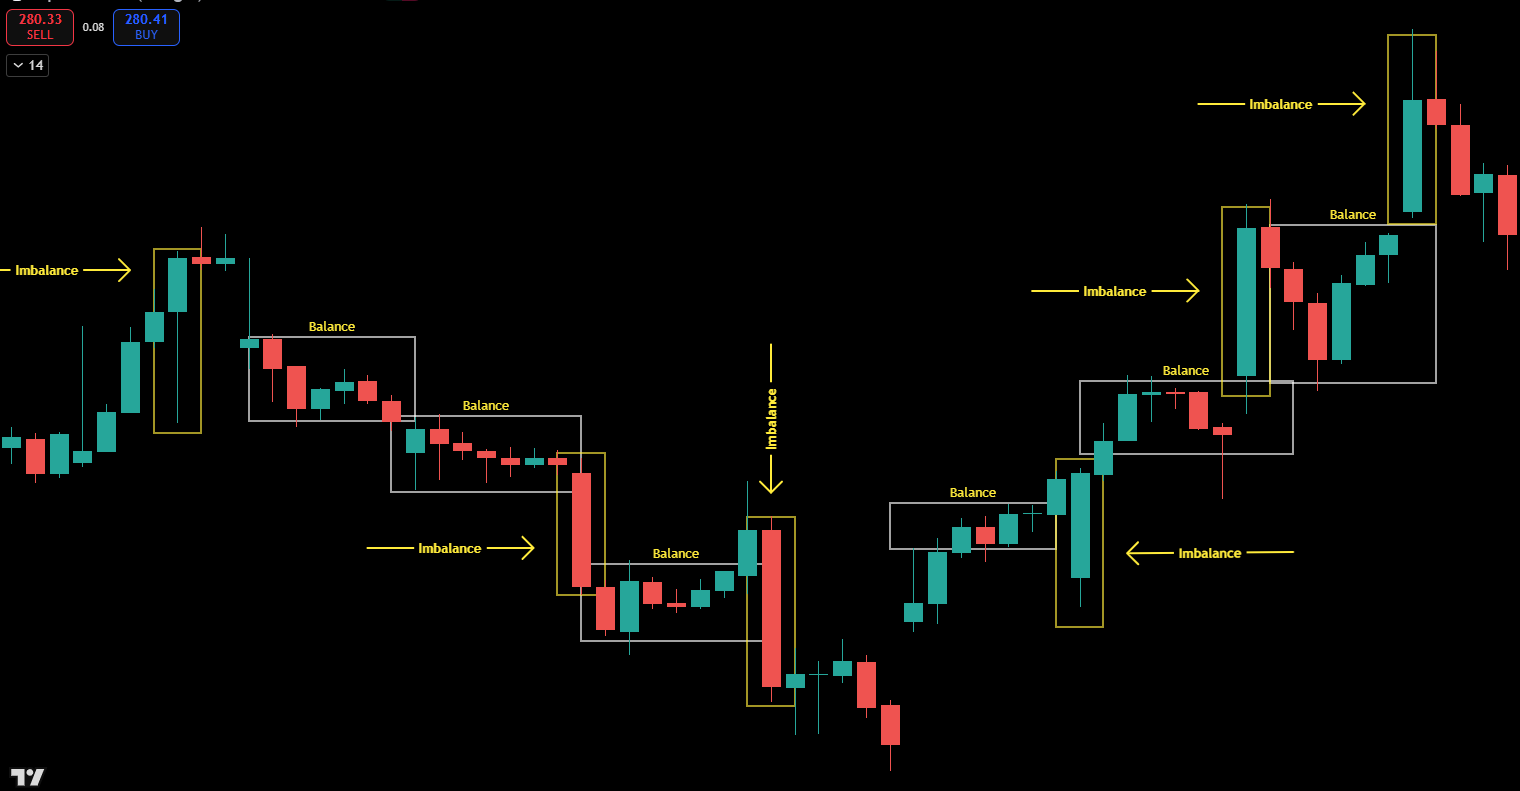
The Cycle of Balance and Rebalance
The market moves in a repeating pattern:
➡️ Balance – Price consolidates and builds orders.
➡️ Imbalance – Price breaks out strongly, leaving inefficiency behind.
➡️ Rebalance – Price retraces to fill that inefficiency before continuing its
trend.
This repeating cycle shows how liquidity flows through the market. Smart traders learn to anticipate these transitions instead of chasing them.
When you understand where the market is balanced or imbalanced, you can identify where price is likely to return and where the next major move may begin.
Fig 3 - The Cycle
How to Use This in Your Trading
✅ Look for imbalance zones with strong impulsive moves because they often mark areas price will revisit.
✅ Wait for balance or sideways structure before the next expansion.
✅ Combine balance zones with higher time frame levels for stronger
confluence.
The goal is not to predict every move but to understand the natural rhythm of expansion and correction.
Price is always searching for fair value.
Your job as a trader is to recognize when the market is efficient and when it is not.
Once you learn to identify balance and imbalance on your charts, you will stop reacting to price and start anticipating it. That is how structure builds confidence, and confidence builds profits.
Happy trading!