The Three Key Components of a Reversal PatternThere are three key components of a reversal pattern, the trend, higher lows and lower highs and time. We will dive into each of these components below.
1. Trending vs. Retracement Moves
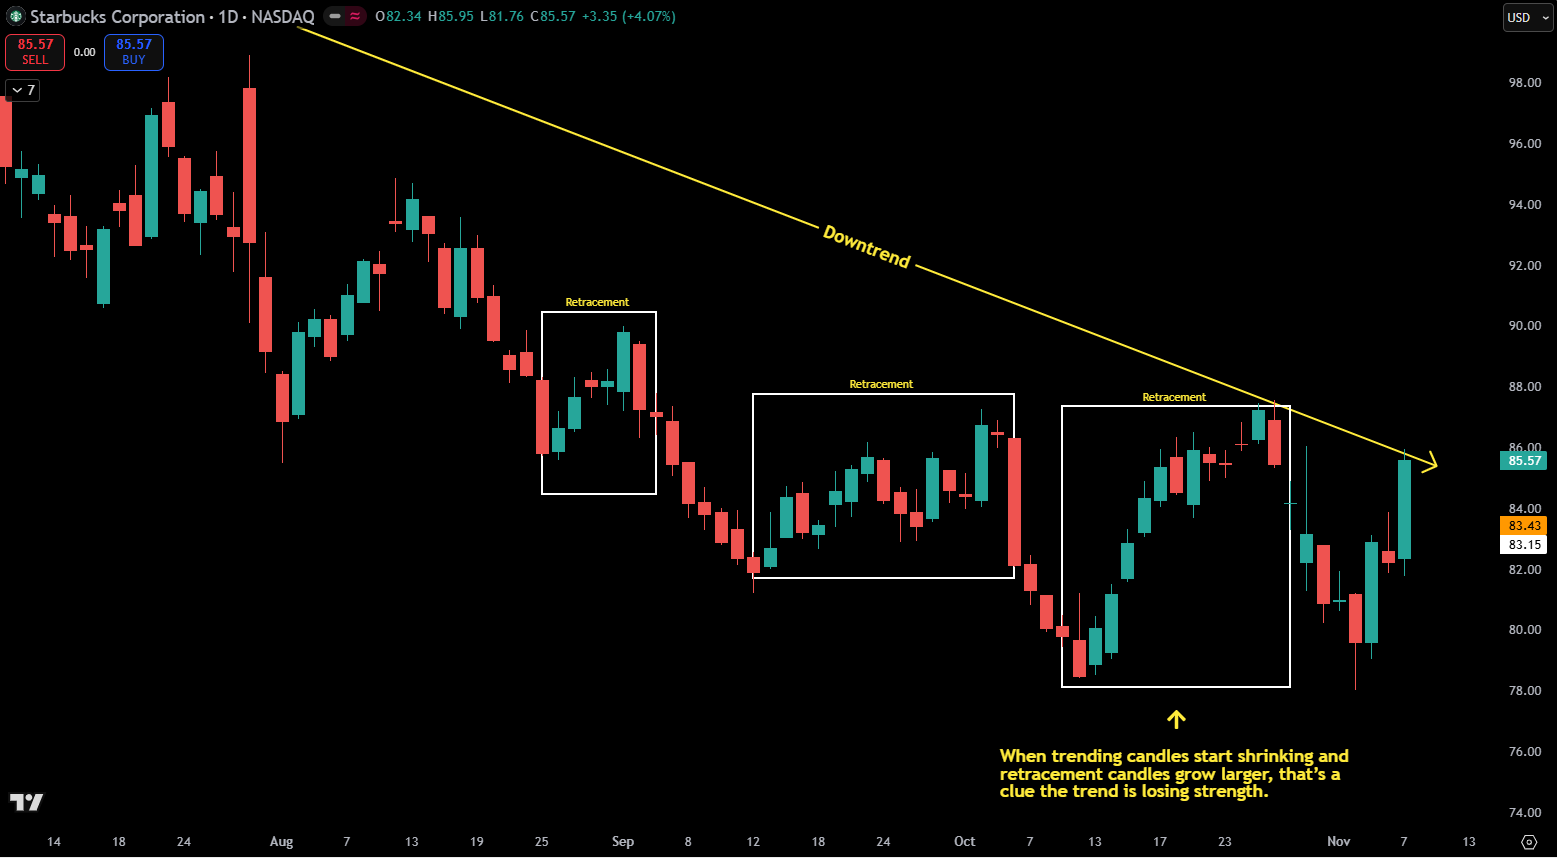
A trending move is the strong leg of the trend; large, decisive candles moving in one direction.
A retracement move is the weaker leg; smaller candles signaling a pause or pullback.
When trending candles start shrinking and retracement candles grow larger, that’s a clue the trend is losing strength.
Fig 1 - Retracement Moves
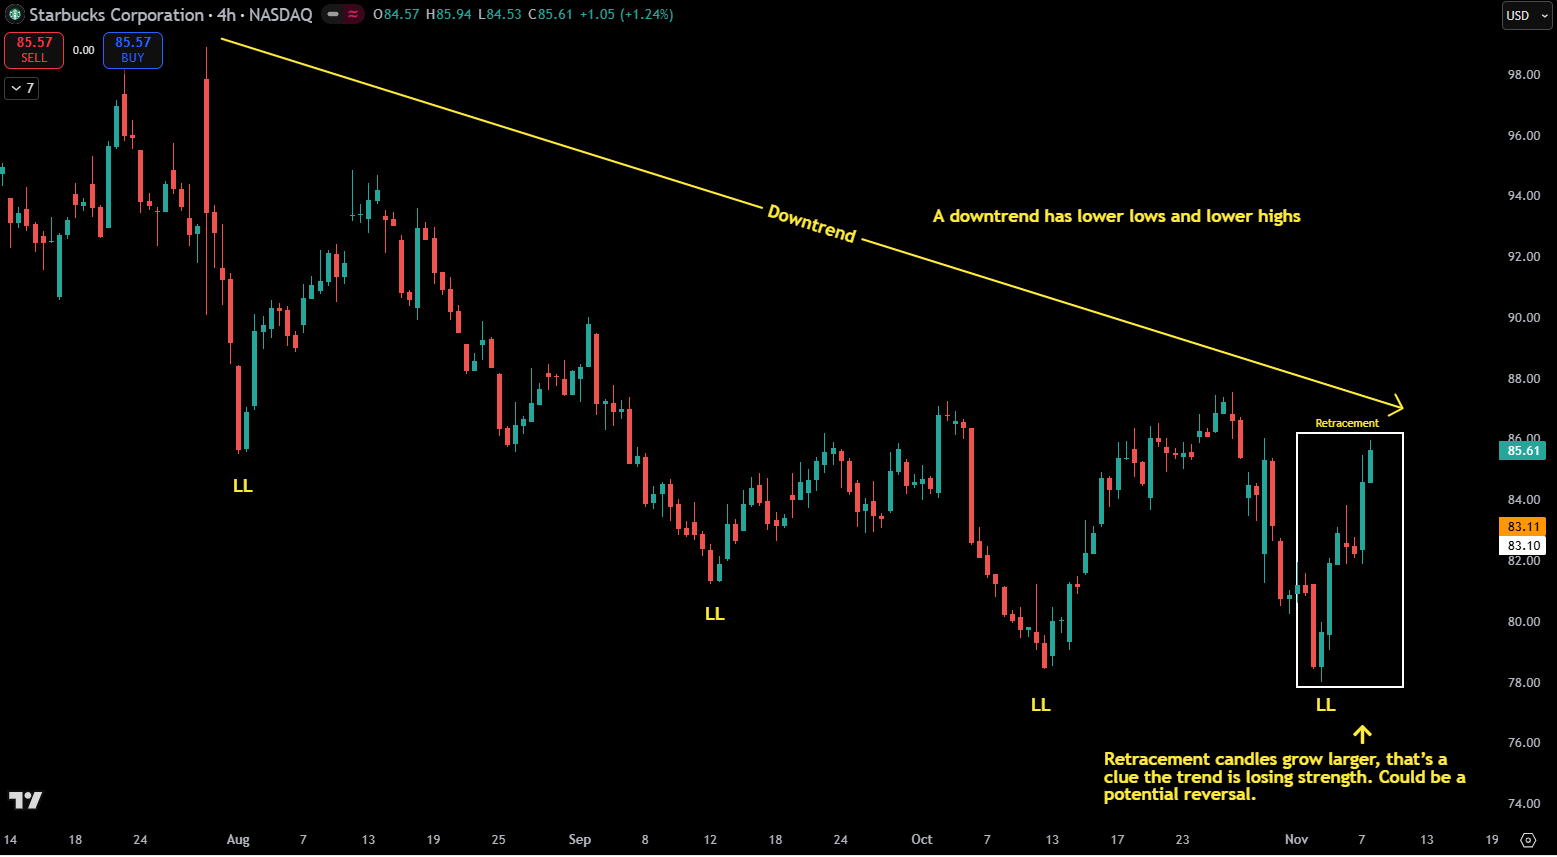
2. Higher Lows and Lower Highs
A series of higher lows means buyers are stepping in sooner, showing confidence.
A series of lower highs means sellers are becoming more aggressive, pushing price down earlier each time.
Neither signal alone confirms a reversal, but together they reveal a shift in market pressure.
Fig 2 - Lower lows in a down move and retracement candles are larger, possible indication of a reversal.
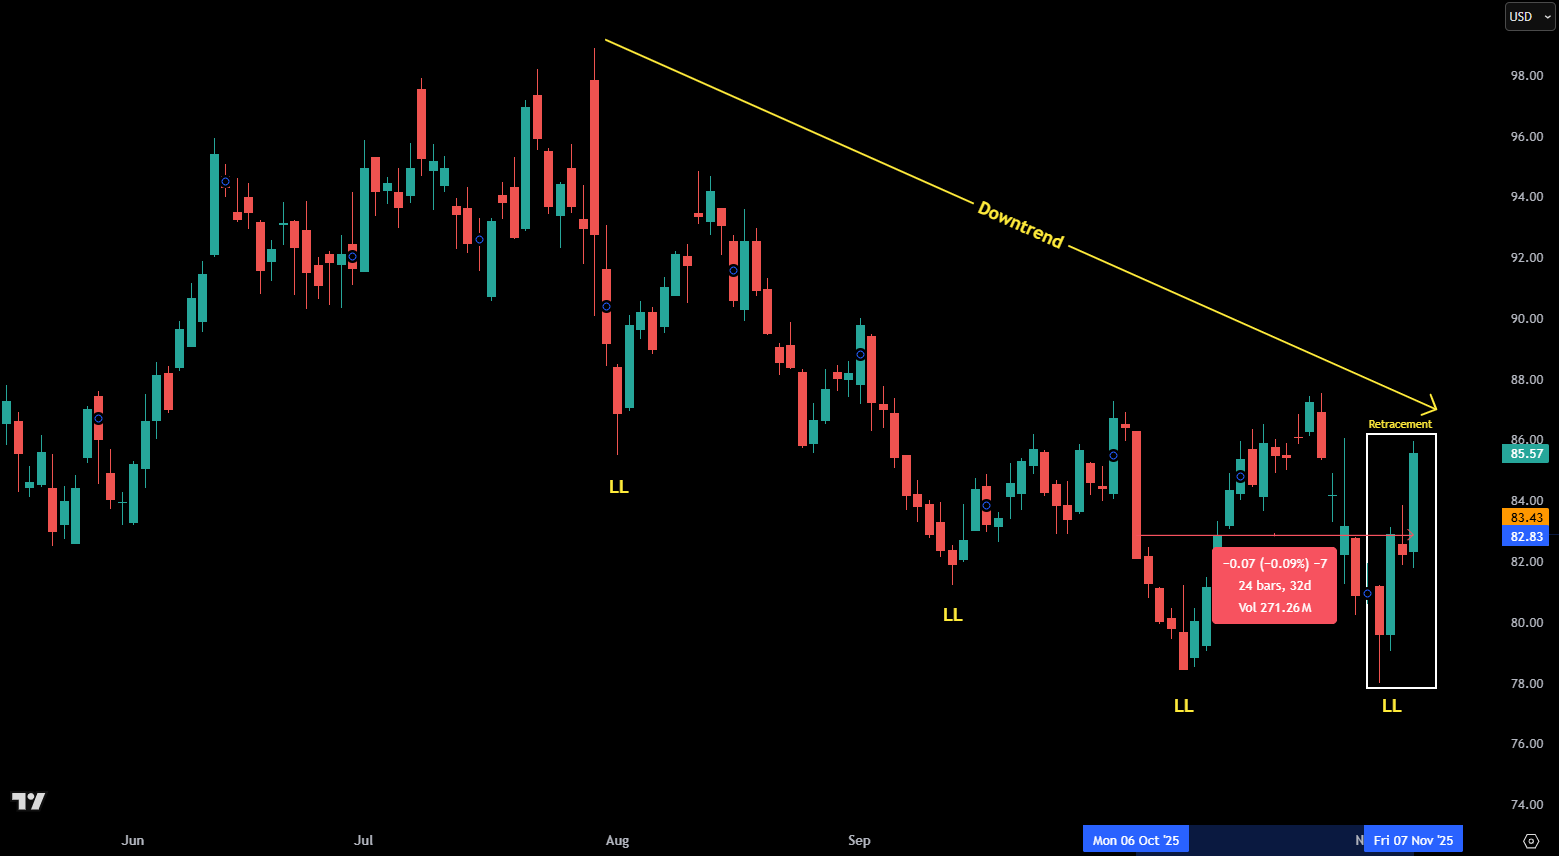
3. The Time Factor
The longer a pattern takes to form, the more significant it becomes. Time equals attention and attention equals orders.
Patterns that build over weeks or months attract traders, investors, and algorithms waiting for a breakout. When that level finally breaks, momentum follows.
Fig 3 - Number of trading and calendar days of Double Bottom Pattern Forming; 24 trading days and 39 calendar days.
Popular Reversal Chart Patterns
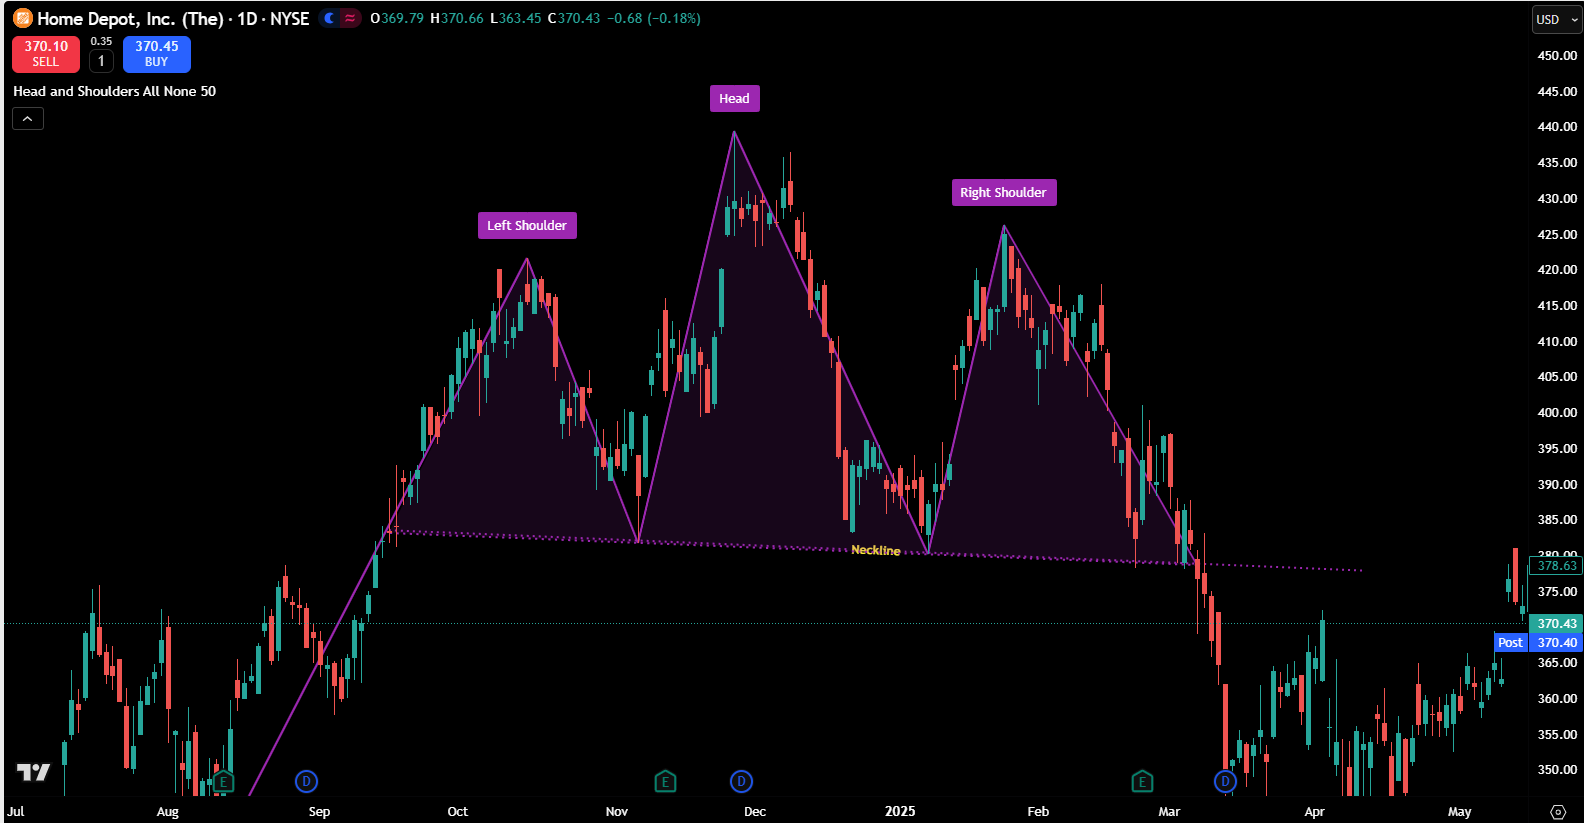
Head and Shoulders (Bearish)
This pattern forms when strong buyers lose control. Each rally weakens, creating smaller highs until the “right shoulder” develops. When price breaks below the neckline, trapped buyers exit and sellers take over.
Fig 4 - Head and Shoulders Pattern (Home Depot Daily Chart)
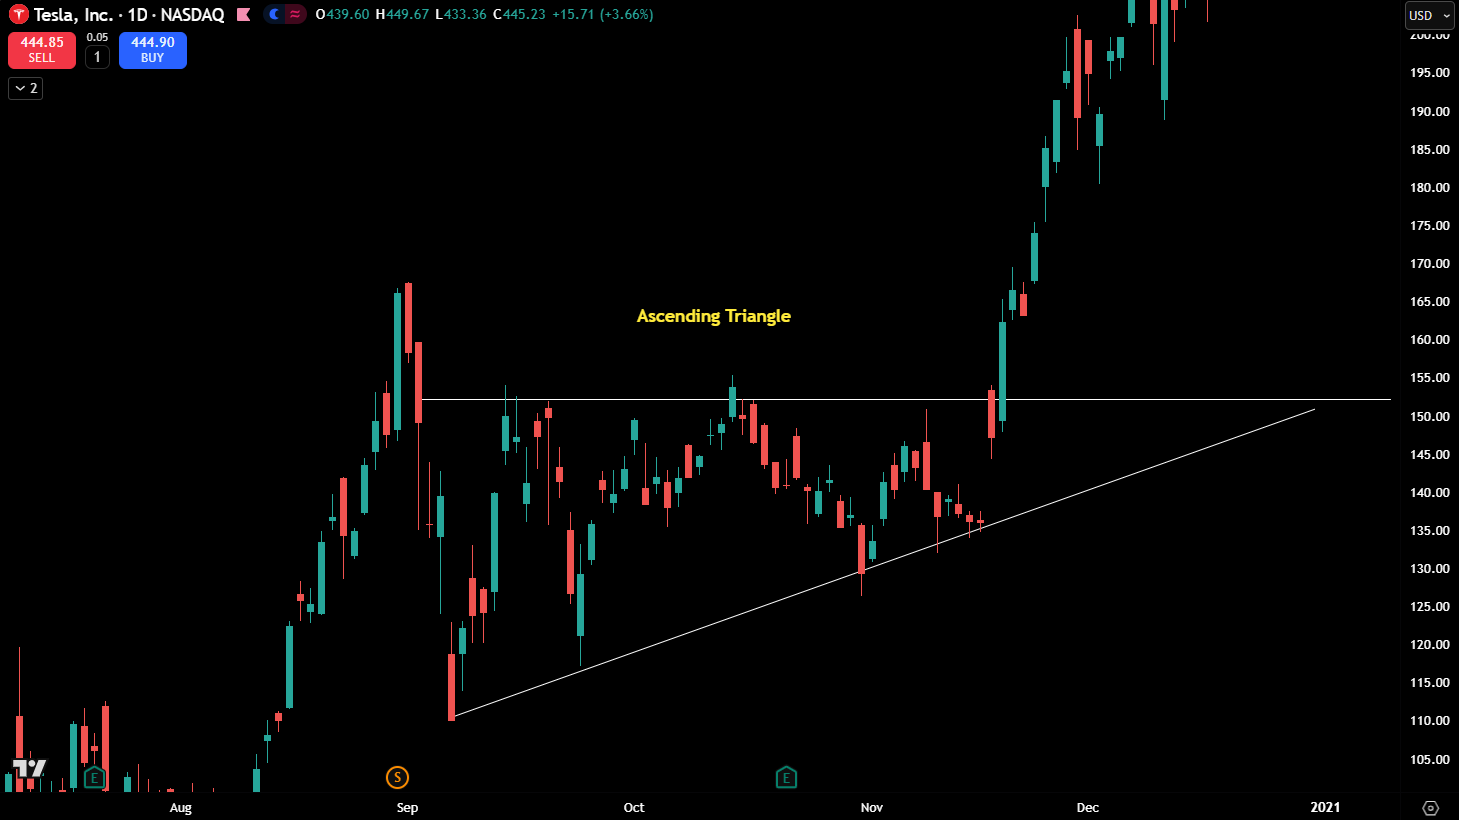
Ascending Triangle (Bullish)
A descending triangle features lower highs pressing into a flat support level. Each attempt to rally fails sooner than the last — showing buyers tiring out. As price coils near the apex, volatility dries up until support gives way.
Fig 5 - Ascending Triangle (Tesla Daily Chart)
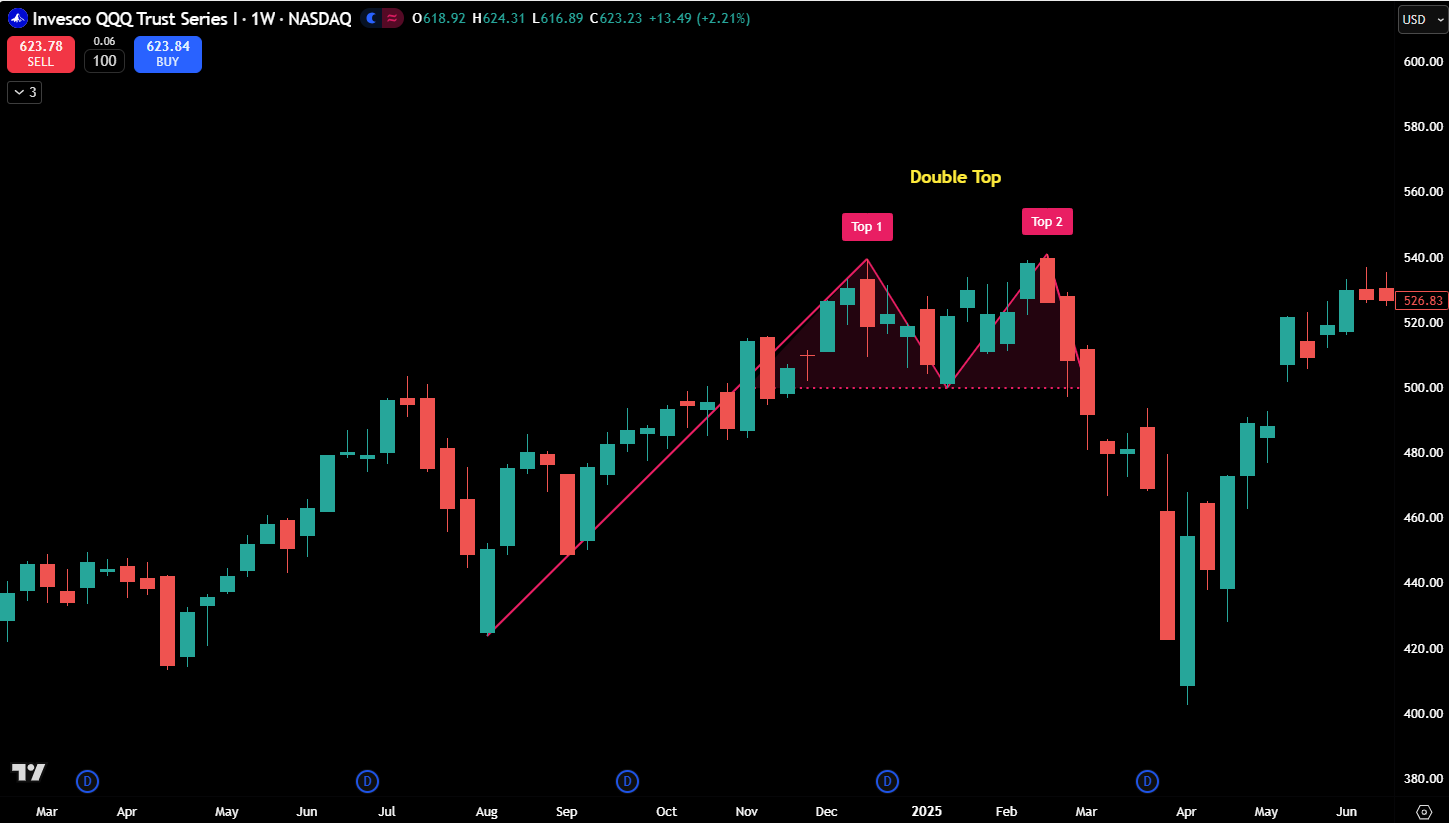
Double Top (Bearish)
A double top looks like an “M.” Price retests a previous high but fails to close above it, creating a false breakout. This failure signals sellers are defending that zone and the uptrend may be ending.
Fig 6 - Double Top (QQQ Weekly chart)
How to Trade Reversal PatternsLook for patterns that take time to form ideally 70 to 80 candles or more. This ensures the setup has matured and that momentum is truly shifting.
Wait for a tight buildup before the breakout. Compression shows the market is preparing for expansion.
Enter on the breakout and place your stop loss just beyond the buildup.
If possible, let the 20 moving average (EMA or MA) catch up to price before entry. When the MA “touches” the pattern before the break, it confirms that momentum and structure are aligning.
What Does “70 to 80 Candles” Really Mean?
The 70 to 80-candle guideline depends on your chart timeframe. It’s not about hours or days it’s about structure and significance.
Chart Timeframe 80 Candles Equals Typical Pattern Duration
- 5-Minute ~ 6.5 trading hours Intraday reversal setup
- 15-Minute ~ 20 trading hours 2–3 trading days
- 1-Hour ~ 80 hours 1–2 weeks of structure
- 4-Hour ~ 320 hours 2–3 weeks of buildup
- Daily ~ 70 to 80 days Roughly 3–4 months of formation
If you’re a day trader, focus on the 15-minute to 1-hour charts. If you’re a swing trader, use the 4-hour or daily chart. The longer the pattern takes to form, the more traders notice it and the stronger the breakout once it triggers.
Trading Tips and Final Thoughts
- Every reversal has three key components: trend vs. retracement, lower highs or higher lows, and time
- The longer a setup takes to form, the stronger the potential move
- Context is everything! Always trade with awareness of the larger trend
- Avoid entering early; wait for confirmation and a clear place for your stop loss
Reversal chart patterns are not about guessing tops and bottoms. They are about reading shifts in control and understanding when momentum quietly changes hands before the crowd sees it.
Go watch the YouTube video explanation here -
Click Here