Price action trading means reading what price is doing on the chart not guessing, not overloading your chart with indicators, but understanding who’s in control: buyers or sellers.
Every candle on the chart tells a story. Once you learn how to read that story, trading becomes much clearer.
Here are 3 simple tips that will help you see what’s really happening behind the candles.
Tip #1 - Trade with the Trend
Trends are your friend until they end when in bends.
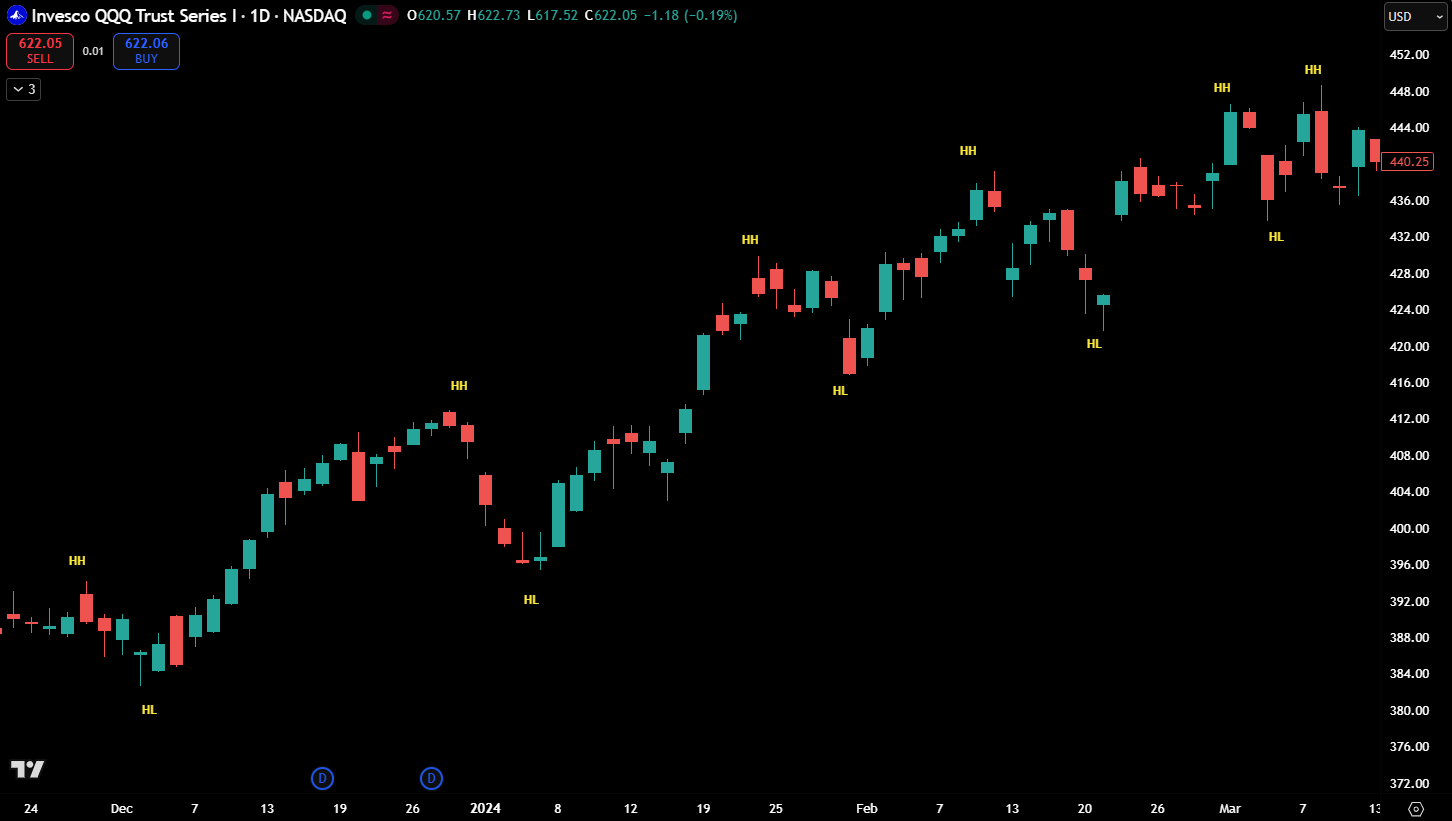
When price is moving in one clear direction, it’s safer and more profitable to trade with it not against it. Trying to pick tops or bottoms usually leads to frustration. Uptrends have higher highs and higher lows where down trends have lower highs and lower lows. Trading with the trend will improve your chances of profiting from market movements.
Fig 1- Uptrend
Tip #2: Use Support and Resistance to Find Good Entry Points
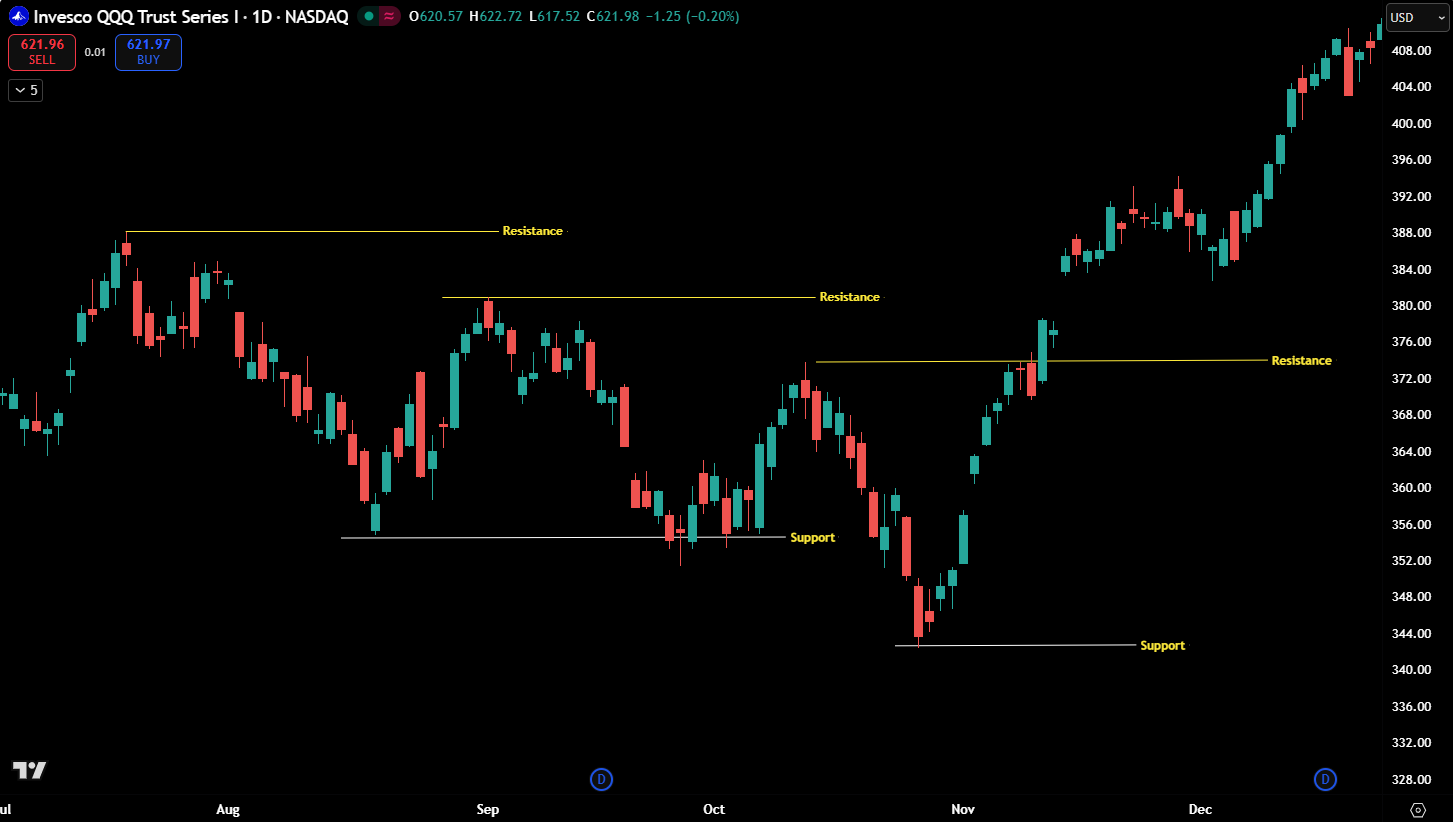
Support and resistance are two of the most powerful tools for finding good entry points in any market. Support acts like a floor where buyers continue to step in and push price higher, while resistance works like a ceiling where sellers apply pressure and slow price down. When price approaches these key levels, traders can look for confirmation signals to enter with better timing and less risk. Mastering support and resistance helps you trade with structure instead of emotion.
Fig 2 - Support and Resistance
NormalTip #3: Small Candles Often Lead to Big Moves
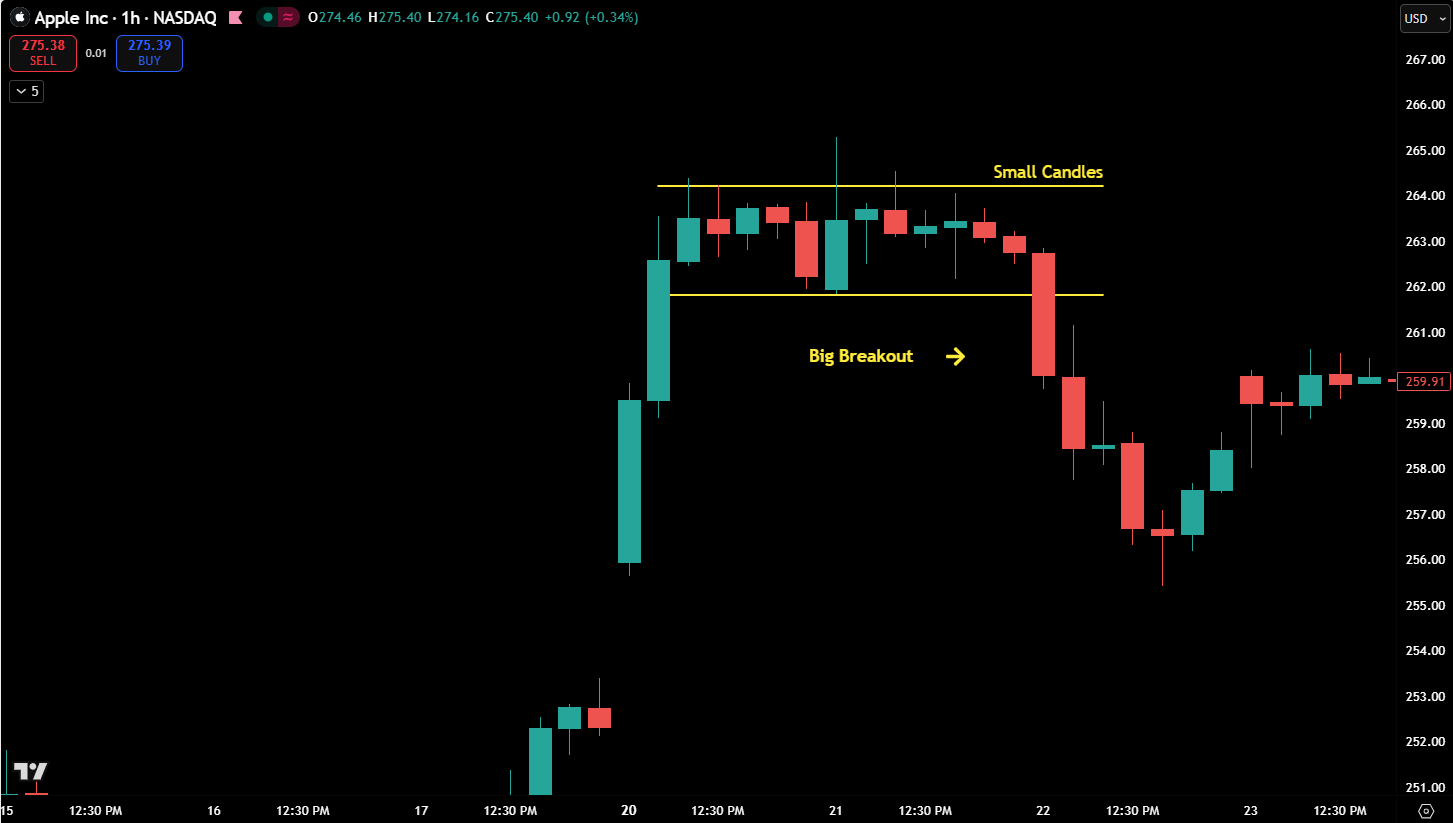
Small candles often signal that the market is taking a breather. This period of quiet usually means buyers and sellers are in balance, waiting for the next push. When that balance breaks, momentum often builds quickly, leading to a strong move in one direction. Paying attention to these small, quiet candles can help you spot big opportunities before they happen. text.
Fig 3 - Small Candles Big Breakout
2. Higher Lows and Lower Highs
A series of higher lows means buyers are stepping in sooner, showing confidence.
A series of lower highs means sellers are becoming more aggressive, pushing price down earlier each time.
Neither signal alone confirms a reversal, but together they reveal a shift in market pressure.
Fig 2 - Lower lows in a down move and retracement candles are larger, possible indication of a reversal.
Price action trading is like learning to read body language except the market is the person. Each candle shows emotion: confidence, hesitation, fear, or strength. Once you start reading those emotions in price, you’ll understand why the market moves not just that it moves.
Happy trading!